|
Shanghai Korain Biotech Co Ltd
elisa kit Elisa Kit, supplied by Shanghai Korain Biotech Co Ltd, used in various techniques. Bioz Stars score: 92/100, based on 1 PubMed citations. ZERO BIAS - scores, article reviews, protocol conditions and more https://www.bioz.com/result/elisa kit/product/Shanghai Korain Biotech Co Ltd Average 92 stars, based on 1 article reviews
elisa kit - by Bioz Stars,
2026-04
92/100 stars
|
Buy from Supplier |
|
MedChemExpress
recombinant galectin 3 protein Recombinant Galectin 3 Protein, supplied by MedChemExpress, used in various techniques. Bioz Stars score: 93/100, based on 1 PubMed citations. ZERO BIAS - scores, article reviews, protocol conditions and more https://www.bioz.com/result/recombinant galectin 3 protein/product/MedChemExpress Average 93 stars, based on 1 article reviews
recombinant galectin 3 protein - by Bioz Stars,
2026-04
93/100 stars
|
Buy from Supplier |
|
R&D Systems
recombinant human galectin 3 protein  Recombinant Human Galectin 3 Protein, supplied by R&D Systems, used in various techniques. Bioz Stars score: 94/100, based on 1 PubMed citations. ZERO BIAS - scores, article reviews, protocol conditions and more https://www.bioz.com/result/recombinant human galectin 3 protein/product/R&D Systems Average 94 stars, based on 1 article reviews
recombinant human galectin 3 protein - by Bioz Stars,
2026-04
94/100 stars
|
Buy from Supplier |
|
R&D Systems
recombinant human galectin 3 binding protein Recombinant Human Galectin 3 Binding Protein, supplied by R&D Systems, used in various techniques. Bioz Stars score: 92/100, based on 1 PubMed citations. ZERO BIAS - scores, article reviews, protocol conditions and more https://www.bioz.com/result/recombinant human galectin 3 binding protein/product/R&D Systems Average 92 stars, based on 1 article reviews
recombinant human galectin 3 binding protein - by Bioz Stars,
2026-04
92/100 stars
|
Buy from Supplier |
|
R&D Systems
human gal3 protein Human Gal3 Protein, supplied by R&D Systems, used in various techniques. Bioz Stars score: 93/100, based on 1 PubMed citations. ZERO BIAS - scores, article reviews, protocol conditions and more https://www.bioz.com/result/human gal3 protein/product/R&D Systems Average 93 stars, based on 1 article reviews
human gal3 protein - by Bioz Stars,
2026-04
93/100 stars
|
Buy from Supplier |
|
Boster Bio
protease inhibitor mixture Protease Inhibitor Mixture, supplied by Boster Bio, used in various techniques. Bioz Stars score: 94/100, based on 1 PubMed citations. ZERO BIAS - scores, article reviews, protocol conditions and more https://www.bioz.com/result/protease inhibitor mixture/product/Boster Bio Average 94 stars, based on 1 article reviews
protease inhibitor mixture - by Bioz Stars,
2026-04
94/100 stars
|
Buy from Supplier |
|
Elabscience Biotechnology
galectin 3 protein Galectin 3 Protein, supplied by Elabscience Biotechnology, used in various techniques. Bioz Stars score: 92/100, based on 1 PubMed citations. ZERO BIAS - scores, article reviews, protocol conditions and more https://www.bioz.com/result/galectin 3 protein/product/Elabscience Biotechnology Average 92 stars, based on 1 article reviews
galectin 3 protein - by Bioz Stars,
2026-04
92/100 stars
|
Buy from Supplier |
|
Rockland Immunochemicals
rabbit polyclonal Rabbit Polyclonal, supplied by Rockland Immunochemicals, used in various techniques. Bioz Stars score: 90/100, based on 1 PubMed citations. ZERO BIAS - scores, article reviews, protocol conditions and more https://www.bioz.com/result/rabbit polyclonal/product/Rockland Immunochemicals Average 90 stars, based on 1 article reviews
rabbit polyclonal - by Bioz Stars,
2026-04
90/100 stars
|
Buy from Supplier |
|
R&D Systems
gal 3 Gal 3, supplied by R&D Systems, used in various techniques. Bioz Stars score: 92/100, based on 1 PubMed citations. ZERO BIAS - scores, article reviews, protocol conditions and more https://www.bioz.com/result/gal 3/product/R&D Systems Average 92 stars, based on 1 article reviews
gal 3 - by Bioz Stars,
2026-04
92/100 stars
|
Buy from Supplier |
|
Boster Bio
gal 3bp elisa kit Gal 3bp Elisa Kit, supplied by Boster Bio, used in various techniques. Bioz Stars score: 90/100, based on 1 PubMed citations. ZERO BIAS - scores, article reviews, protocol conditions and more https://www.bioz.com/result/gal 3bp elisa kit/product/Boster Bio Average 90 stars, based on 1 article reviews
gal 3bp elisa kit - by Bioz Stars,
2026-04
90/100 stars
|
Buy from Supplier |
|
Proteintech
human lgals3bp elisa kit  Human Lgals3bp Elisa Kit, supplied by Proteintech, used in various techniques. Bioz Stars score: 93/100, based on 1 PubMed citations. ZERO BIAS - scores, article reviews, protocol conditions and more https://www.bioz.com/result/human lgals3bp elisa kit/product/Proteintech Average 93 stars, based on 1 article reviews
human lgals3bp elisa kit - by Bioz Stars,
2026-04
93/100 stars
|
Buy from Supplier |
|
Sino Biological
human gal 3  Human Gal 3, supplied by Sino Biological, used in various techniques. Bioz Stars score: 94/100, based on 1 PubMed citations. ZERO BIAS - scores, article reviews, protocol conditions and more https://www.bioz.com/result/human gal 3/product/Sino Biological Average 94 stars, based on 1 article reviews
human gal 3 - by Bioz Stars,
2026-04
94/100 stars
|
Buy from Supplier |
Image Search Results
Journal: bioRxiv
Article Title: Defining the mechanism of galectin-3-mediated TGF-β1 activation and its role in lung fibrosis
doi: 10.1101/2023.10.11.561855
Figure Lengend Snippet: Representative western blot of pSmad2 levels in (A) non-IPF HLFs (N=3) and (B) iHBECs (N=2) pre-treated with S0 μM SB-431S42 (ALKS inhibitor) or 1 μM GB0139 (galectin-3 inhibitor) for 20 minutes prior to 2-hour treatment with 10 μg/mL galectin-3 or 2 ng/mL TGF-β1. Western blot bands were quantified using densitometry analysis and presented as a ratio of pSmad2/tSmad2.
Article Snippet: After serum starvation, cells were stimulated with either 10 μg/mL
Techniques: Western Blot

Journal: bioRxiv
Article Title: Defining the mechanism of galectin-3-mediated TGF-β1 activation and its role in lung fibrosis
doi: 10.1101/2023.10.11.561855
Figure Lengend Snippet: Representative western blots of pSmad2 levels in non-IPF HLFs pre-treated with (A) NOTT199SS β1 inhibitor (0.1-100 nM) or (B-D) galectin-3 inhibitors GB0139, GB1107 and GB1211 (1 μM) or GB0149 (0.1-10 μM) for 20 minutes prior to stimulation with 2 ng/mL TGF-β1 (2-hour) or 50 μM LPA (4-hour). Cells pre-treated with S0 μM SB-431542 (ALK5 inhibitor) were included as a control demonstrating maximal inhibition of pSmad2 signaling. Western blot bands were quantified using densitometry analysis and presented as a ratio of pSmad2/tSmad2.
Article Snippet: After serum starvation, cells were stimulated with either 10 μg/mL
Techniques: Western Blot, Inhibition

Journal: bioRxiv
Article Title: Defining the mechanism of galectin-3-mediated TGF-β1 activation and its role in lung fibrosis
doi: 10.1101/2023.10.11.561855
Figure Lengend Snippet: Soluble galectin-3 (sequential injections, 19.5 - 5000 nM) binding to glycosylated or deglycosylated αv integrins: (A) αvβ1, (B) αvβS and (C) αvβ6 immobilised on the surface of a Series S sensor chip CM5 (approximately 1000 RU). (D) Soluble galectin-3 (sequential injections, 156.3-20000 nM) binding to glycosylated or deglycosylated TGFβRII immobilised to a Series S sensor chip CMS (approximately 400 RU). SPR signals were measured in RU and all sensorgrams baseline-corrected. Binding response values plotted in GraphPad Prism with connecting line/curve shown.
Article Snippet: After serum starvation, cells were stimulated with either 10 μg/mL
Techniques: Binding Assay
Journal: bioRxiv
Article Title: Defining the mechanism of galectin-3-mediated TGF-β1 activation and its role in lung fibrosis
doi: 10.1101/2023.10.11.561855
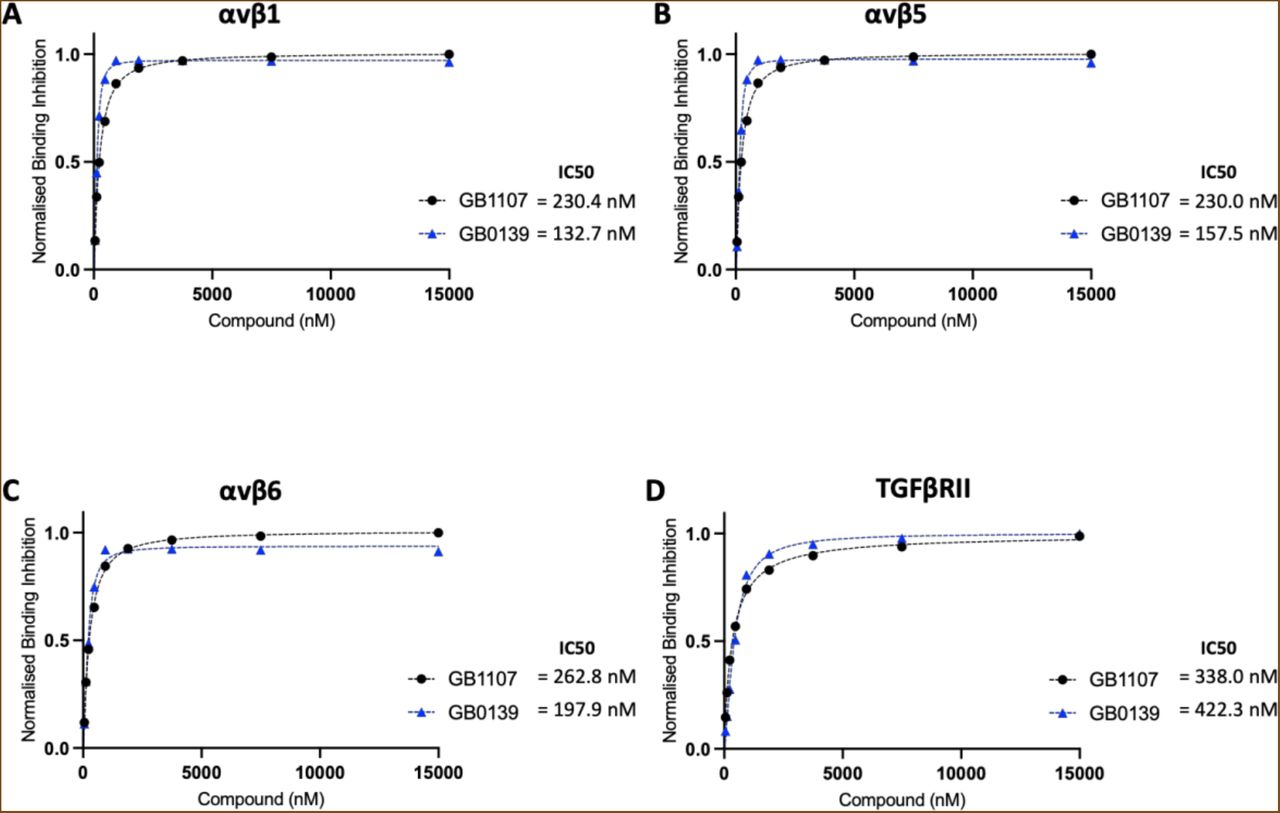
Figure Lengend Snippet: Solution competition binding assays performed with the galectin-3 inhibitor GB0139 (blue) or GB1107 (black) for αv integrins: (A) αvβ1, (B) αvβS and (C) αvβ6 or (D) TGFβRII in the presence of galectin-3 at 625 nM. Response values are normalised with respect to the highest binding response (DMSO control) and competitive inhibition graphs plotted in GraphPad Prism. IC50 values were calculated by non-linear regression analysis (binding saturation) - specific binding with hill slope.
Article Snippet: After serum starvation, cells were stimulated with either 10 μg/mL
Techniques: Binding Assay, Inhibition

Journal: bioRxiv
Article Title: Defining the mechanism of galectin-3-mediated TGF-β1 activation and its role in lung fibrosis
doi: 10.1101/2023.10.11.561855
Figure Lengend Snippet: Representative western blots showing co-immunoprecipitation of galectin-3 and the β1 integrin. Whole-cell protein lysates (6S0 μg/ IP reaction) from untreated non-IPF HLFs p6 (N=3) were immunoprecipitated with an anti-β1 integrin antibody (10 μg/ IP reaction) and immunoblotted for galectin-3 (upper panel) or immunoprecipitated with an anti-galectin-3 antibody (10 μg/ IP reaction) and immunoblotted for the β1 integrin (lower panel). Co-IP input, FT and wash steps loaded as controls. Proteins separated by reducing SDS-PAGE and target protein size estimated from the marker migration pattern.
Article Snippet: After serum starvation, cells were stimulated with either 10 μg/mL
Techniques: Western Blot, Immunoprecipitation, Co-Immunoprecipitation Assay, SDS Page, Marker, Migration

Journal: bioRxiv
Article Title: Defining the mechanism of galectin-3-mediated TGF-β1 activation and its role in lung fibrosis
doi: 10.1101/2023.10.11.561855
Figure Lengend Snippet: Representative confocal microscopy images (63x magnification) showing PLA of galectin-3 and the β1 integrin in (A) non-IPF HLFs p3-4 (N=3) or (B) IPF HLFs p3 (N=4) in the absence or presence of TGF-β1 stimulation (2 ng/mL TGF-β1 for 24 hours). Cells probed with a mouse anti-β1 integrin primary antibody (S μg/mL) and a rabbit anti-galectin-3 primary antibody (S μg/mL) followed by anti-rabbit PLUS and anti-mouse MINUS probes. Colocalization of galectin-3 and the β1 integrin 40 nm indicated by red fluorescence with DAPI counterstaining (blue).
Article Snippet: After serum starvation, cells were stimulated with either 10 μg/mL
Techniques: Confocal Microscopy, Fluorescence

Journal: bioRxiv
Article Title: Defining the mechanism of galectin-3-mediated TGF-β1 activation and its role in lung fibrosis
doi: 10.1101/2023.10.11.561855
Figure Lengend Snippet: (A) Downstream signaling of TGF-β1 following its integrin-mediated activation requires the integrin and TGF-β1 receptor to be in close proximity on the cell surface. (B) The galectin-3 carbohydrate binding domain binds to the glycosylation sites on αv integrins and the TGF-β1 receptor forming a galectin lattice at the cell surface which facilitates receptor clustering. This scaffold ensures that TGF-β1 can act on its receptor and potentiates TGF-β1 signaling. GB0139 binds to the galectin-3 carbohydrate recognition domain and blocks these protein-glycan interactions.
Article Snippet: After serum starvation, cells were stimulated with either 10 μg/mL
Techniques: Activation Assay, Binding Assay
Journal: Matrix biology : journal of the International Society for Matrix Biology
Article Title: Molecular and epigenetic ex vivo profiling of testis cancer-associated fibroblasts and their interaction with germ cell tumor cells and macrophages.
doi: 10.1016/j.matbio.2024.06.001
Figure Lengend Snippet: Fig. 4. (A) Visualization of the RNAseq expression data and (B) LC-MS-based secretome data of IGFBP1 / IGFBP1, LGALS3BP / LGALS3BP, LYVE1 / LYVE1, and PTX3 / PTX3 in CAF populations compared to nFB, and (C) qRT-PCR-based validation of IGFBP1, LGALS3BP, LYVE1, and PTX3 expression in nFB and CAF (SE-CAF = 6, EC- CAF = 3, TER-CAF = 3, nFB = 5). SD is based on biological replicates. GAPDH and ACTB were used as housekeepers and for data normalization. (D) Measurement of LGALS3BP secretion in nFB and CAF via ELISA, dots indicate the biological replicates (n = 3 / subgroup). (E) Cell proliferation assay of TCam-2 (SE) and 2102EP, NCCIT, NT2/D1 (EC) treated daily with recombinant proteins (LGALS3BP, LYVE1, IGFBP1; 10 - 100 ng / mL) over 10 d. SE-related SD is based on technical triplicates; EC-related SD is based on biological triplicates (each in technical triplicates). (F) qRT-PCR analysis of expression of cisplatin resistance-associated factors in TCam-2 (SE) and 2102EP, NCCIT, NT2/D1 (EC) treated daily with recombinant proteins (LGALS3BP, LYVE1, IGFBP1; 10 - 100 ng / mL) over 10 d SE-related SD is based on technical triplicates; EC-related SD is based on biological triplicates (each in technical triplicates). GAPDH and ACTB were used as housekeepers and for data normalization. Dashed lines indicate the threshold of a FC > 1.5 / < -1.5.
Article Snippet: The
Techniques: Expressing, Liquid Chromatography with Mass Spectroscopy, Quantitative RT-PCR, Biomarker Discovery, Enzyme-linked Immunosorbent Assay, Proliferation Assay, Recombinant

Journal: Matrix biology : journal of the International Society for Matrix Biology
Article Title: Molecular and epigenetic ex vivo profiling of testis cancer-associated fibroblasts and their interaction with germ cell tumor cells and macrophages.
doi: 10.1016/j.matbio.2024.06.001
Figure Lengend Snippet: Fig. 5. (A) Experimental setup of this analysis. THP-1 monocytes were differentiated into M0 macrophages by PMA. Afterwards, macrophages were cultivated in CM or treated with recombinant proteins, subsequently expression of M1LPS/IFNγ and M2IL4/IL13 marker genes was analyzed by qRT-PCR. (B) Heatmap of gene expression levels (FC to control) of THP-1-M0-macrophages cultivated in nFB, SE- / EC-CAF CM (n = 3 / each) or (C) treated with recombinant proteins (LGALS3BP, LYVE1, PTX3; 10 - 100 ng / mL) over 72 h. GAPDH and ACTB were used as housekeepers and for data normalization. Average overall expression intensities were used for clustering. Arrows highlight genes used for futher analysis.
Article Snippet: The
Techniques: Recombinant, Expressing, Marker, Quantitative RT-PCR, Gene Expression, Control
Journal: Cell Death Discovery
Article Title: RNF8 enhances the sensitivity of PD-L1 inhibitor against melanoma through ubiquitination of galectin-3 in stroma
doi: 10.1038/s41420-023-01500-3
Figure Lengend Snippet: A Gene set enrichment analysis showing changed pathways in RNF8 deficieny cells. B Gene set enrichment analysis showing changed biological process in RNF8 deficieny cells. C Volcano plot of ubiquitination modifications omics in RNF8 deficiency cells. D Western blot of gal-3 in tumor-beared RNF8 +/+ and RNF8 −/− mice. E Western blot of gal-3 in center and periphery of tumor-beared RNF8 +/+ and RNF8 −/− mice. F The technical routine of gal-3 binding with IL-12 or IFN-γ. G IL-12 and ( H ) IFN-γ content in the supernatant were measured by ELISA after incubation with gal-3-coated beads in the presence or absence of 100 mM lactose (left) or 50 mM LAC (right). The human melanoma A375 cells and human lung cancer A549 cells were treated with 0.2 g/L Na 2 SO 3 . I – K Gal-3, HIF-1α, p-IκBα, NF-κB, and p-NF-κB expression in A375 and A549 were detected by western blot at different time after treating with Na 2 SO 3 . L Western blot investigation of HIF-1α in tumor center and periphery in RNF8 +/+ and RNF8 −/− mice. M The schematic diagram of a mechanism related to gal-3 in TME. All values were presented as the mean ± SD ( n = 3). Student’s t -test; * P < 0.05, ** P < 0.01, *** P < 0.001, **** P < 0.0001.
Article Snippet: Dynabeads M-280 Streptavidin (11-205-D, Invitrogen) were incubated with saturating amounts of recombinant
Techniques: Western Blot, Binding Assay, Enzyme-linked Immunosorbent Assay, Incubation, Expressing

Journal: Cell Death Discovery
Article Title: RNF8 enhances the sensitivity of PD-L1 inhibitor against melanoma through ubiquitination of galectin-3 in stroma
doi: 10.1038/s41420-023-01500-3
Figure Lengend Snippet: A Western blot investigation of RNF8 and gal-3 expression in shCtrl and shRNF8 groups in 293 T cell. B RNF8 and gal-3 expression in Ctrl-OV and RNF8-overexpression (RNF8-OV) groups. C A375 cells were transfected with LV-RNF8 for shRNF8 or RNF8-OV. The yellow arrows indicated the successful transfected cells, and the purple arrows indicated the non-transfected cells. D The statistical analysis of gal-3 expression in A375 cells. E Fluorescent staining of endogenous RNF8 and gal-3 distribution in A375 cells. F , G Co-IP analysis of interaction between endogenous RNF8 and gal-3 in 293 T ( F ) and A375 cells ( G ). H , I Co-IP analysis of interaction between exogenous RNF8 and gal-3 in 293 T ( H ) and A375 cells ( I ), wcl whole cell lysate. The values were presented as the mean ± SD ( n = 3). Student’s t -test; * P < 0.05, ** P < 0.01, *** P < 0.001.
Article Snippet: Dynabeads M-280 Streptavidin (11-205-D, Invitrogen) were incubated with saturating amounts of recombinant
Techniques: Western Blot, Expressing, Over Expression, Transfection, Staining, Co-Immunoprecipitation Assay

Journal: Cell Death Discovery
Article Title: RNF8 enhances the sensitivity of PD-L1 inhibitor against melanoma through ubiquitination of galectin-3 in stroma
doi: 10.1038/s41420-023-01500-3
Figure Lengend Snippet: A CHX (5 μg/mL) was used in 293 T cells to measure gal-3 degradation. B 293 T cells were treated with or without 10 mmol/L MG132 for 4 h. The ubiquitination level of gal-3 was detected. C HA-tagged gal-3 and His-tagged Ub plasmids were co-transfected into 293 T cells for 36 h, followed by cell lysate preparation and IP assay with anti-HA beads followed by immunoblotting with indicated antibodies. D 293 T cells were treated with exogenous RNF8 (shRNF8 or RNF8-OV), gal-3 and Ub, and the ubiquitination of HA was investigated. E – G 293 T cells were transfected with LV-shRNF8 or LV-RNF8-OV, and the ubiquitination ( E ), K48 ( F ), and K63 ( G ) of gal-3 were investigated. H 293 T cells were transfected with gal-3K176R (mutation of gal-3 at lysine 176 site), the expression of gal-3 was investigated. I – K 293 T cells were transfected with Flag-Ctrl, Flag-LGALS3, and Flag-K176R, and the total ubiquitination ( I ), K48 linked ( J ), and K63-linked ( K ) ubiquitination was detected.
Article Snippet: Dynabeads M-280 Streptavidin (11-205-D, Invitrogen) were incubated with saturating amounts of recombinant
Techniques: Transfection, Western Blot, Mutagenesis, Expressing

Journal: Cell Death Discovery
Article Title: RNF8 enhances the sensitivity of PD-L1 inhibitor against melanoma through ubiquitination of galectin-3 in stroma
doi: 10.1038/s41420-023-01500-3
Figure Lengend Snippet: A , B LAC was injected intratumorally at a single dose of 0.1 μmol per mice after tumor formation, the ratio of tumor weight ( A ), tumor volumes ( B ) were detected. C , D HE staining of implanted melanomas in RNF8 +/+ and RNF8 −/− mice treated with DMSO or LAC. The arrow points to TILs. E , F SPADE analysis of TILs in RNF8 +/+ + DMSO, RNF8 +/+ + LAC, RNF8 −/− + DMSO, and RNF8 −/− + LAC mice. G Analysis of IL-12 by immunohistochemical staining (Supplementary Fig. ) of tumors in above groups. H Analysis of IFN-γ by immunohistochemical staining (Supplementary Fig. ) of tumors in above groups. I Western blot of CD3, gal-3, IL-12, IFN-γ, CXCL-9, and CXCL-10 expression in tumor center and periphery in above groups. The values were presented as the mean ± SD ( n = 3). Student’s t -test; * P < 0.05, ** P < 0.01, *** P < 0.001.
Article Snippet: Dynabeads M-280 Streptavidin (11-205-D, Invitrogen) were incubated with saturating amounts of recombinant
Techniques: Injection, Staining, Immunohistochemical staining, Western Blot, Expressing